OFFICIAL SHOPIFY PARTNERS®
YOUR PAGE
VS THE DUDES
Most agencies want your money. We want your competitors’ customers, their revenue, and their soul. We outconvert your page — or we work for free until we do. We’ve never worked for free.


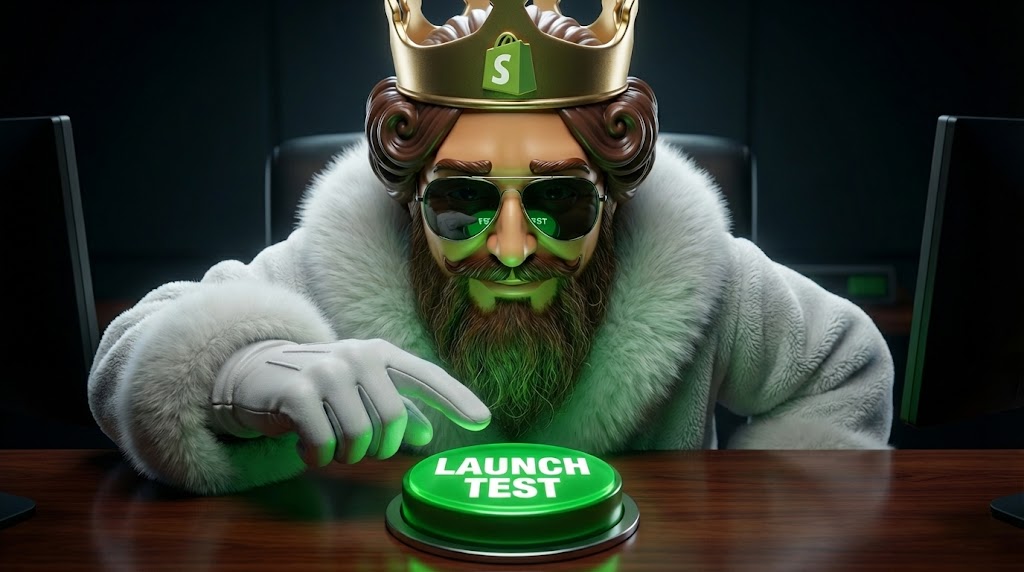
UNDISPUTED CHAMPION.
THE MIKE TYSON OF CRO.
7 days from handshake to live A/B test. No onboarding decks. No agency theater.


WE FIND THE AREAS WE CAN IMPROVE AND BUILD YOUR GAME PLAN.
WE BUILD YOUR NEW PAGE AND LAUNCH HEAD-TO-HEAD A/B TESTS.
OUR PAGE OUTPERFORMS YOURS. EVERY. SINGLE. TIME.
WE KEEP OPTIMIZING UNTIL THE NUMBERS SPEAK FOR THEMSELVES.
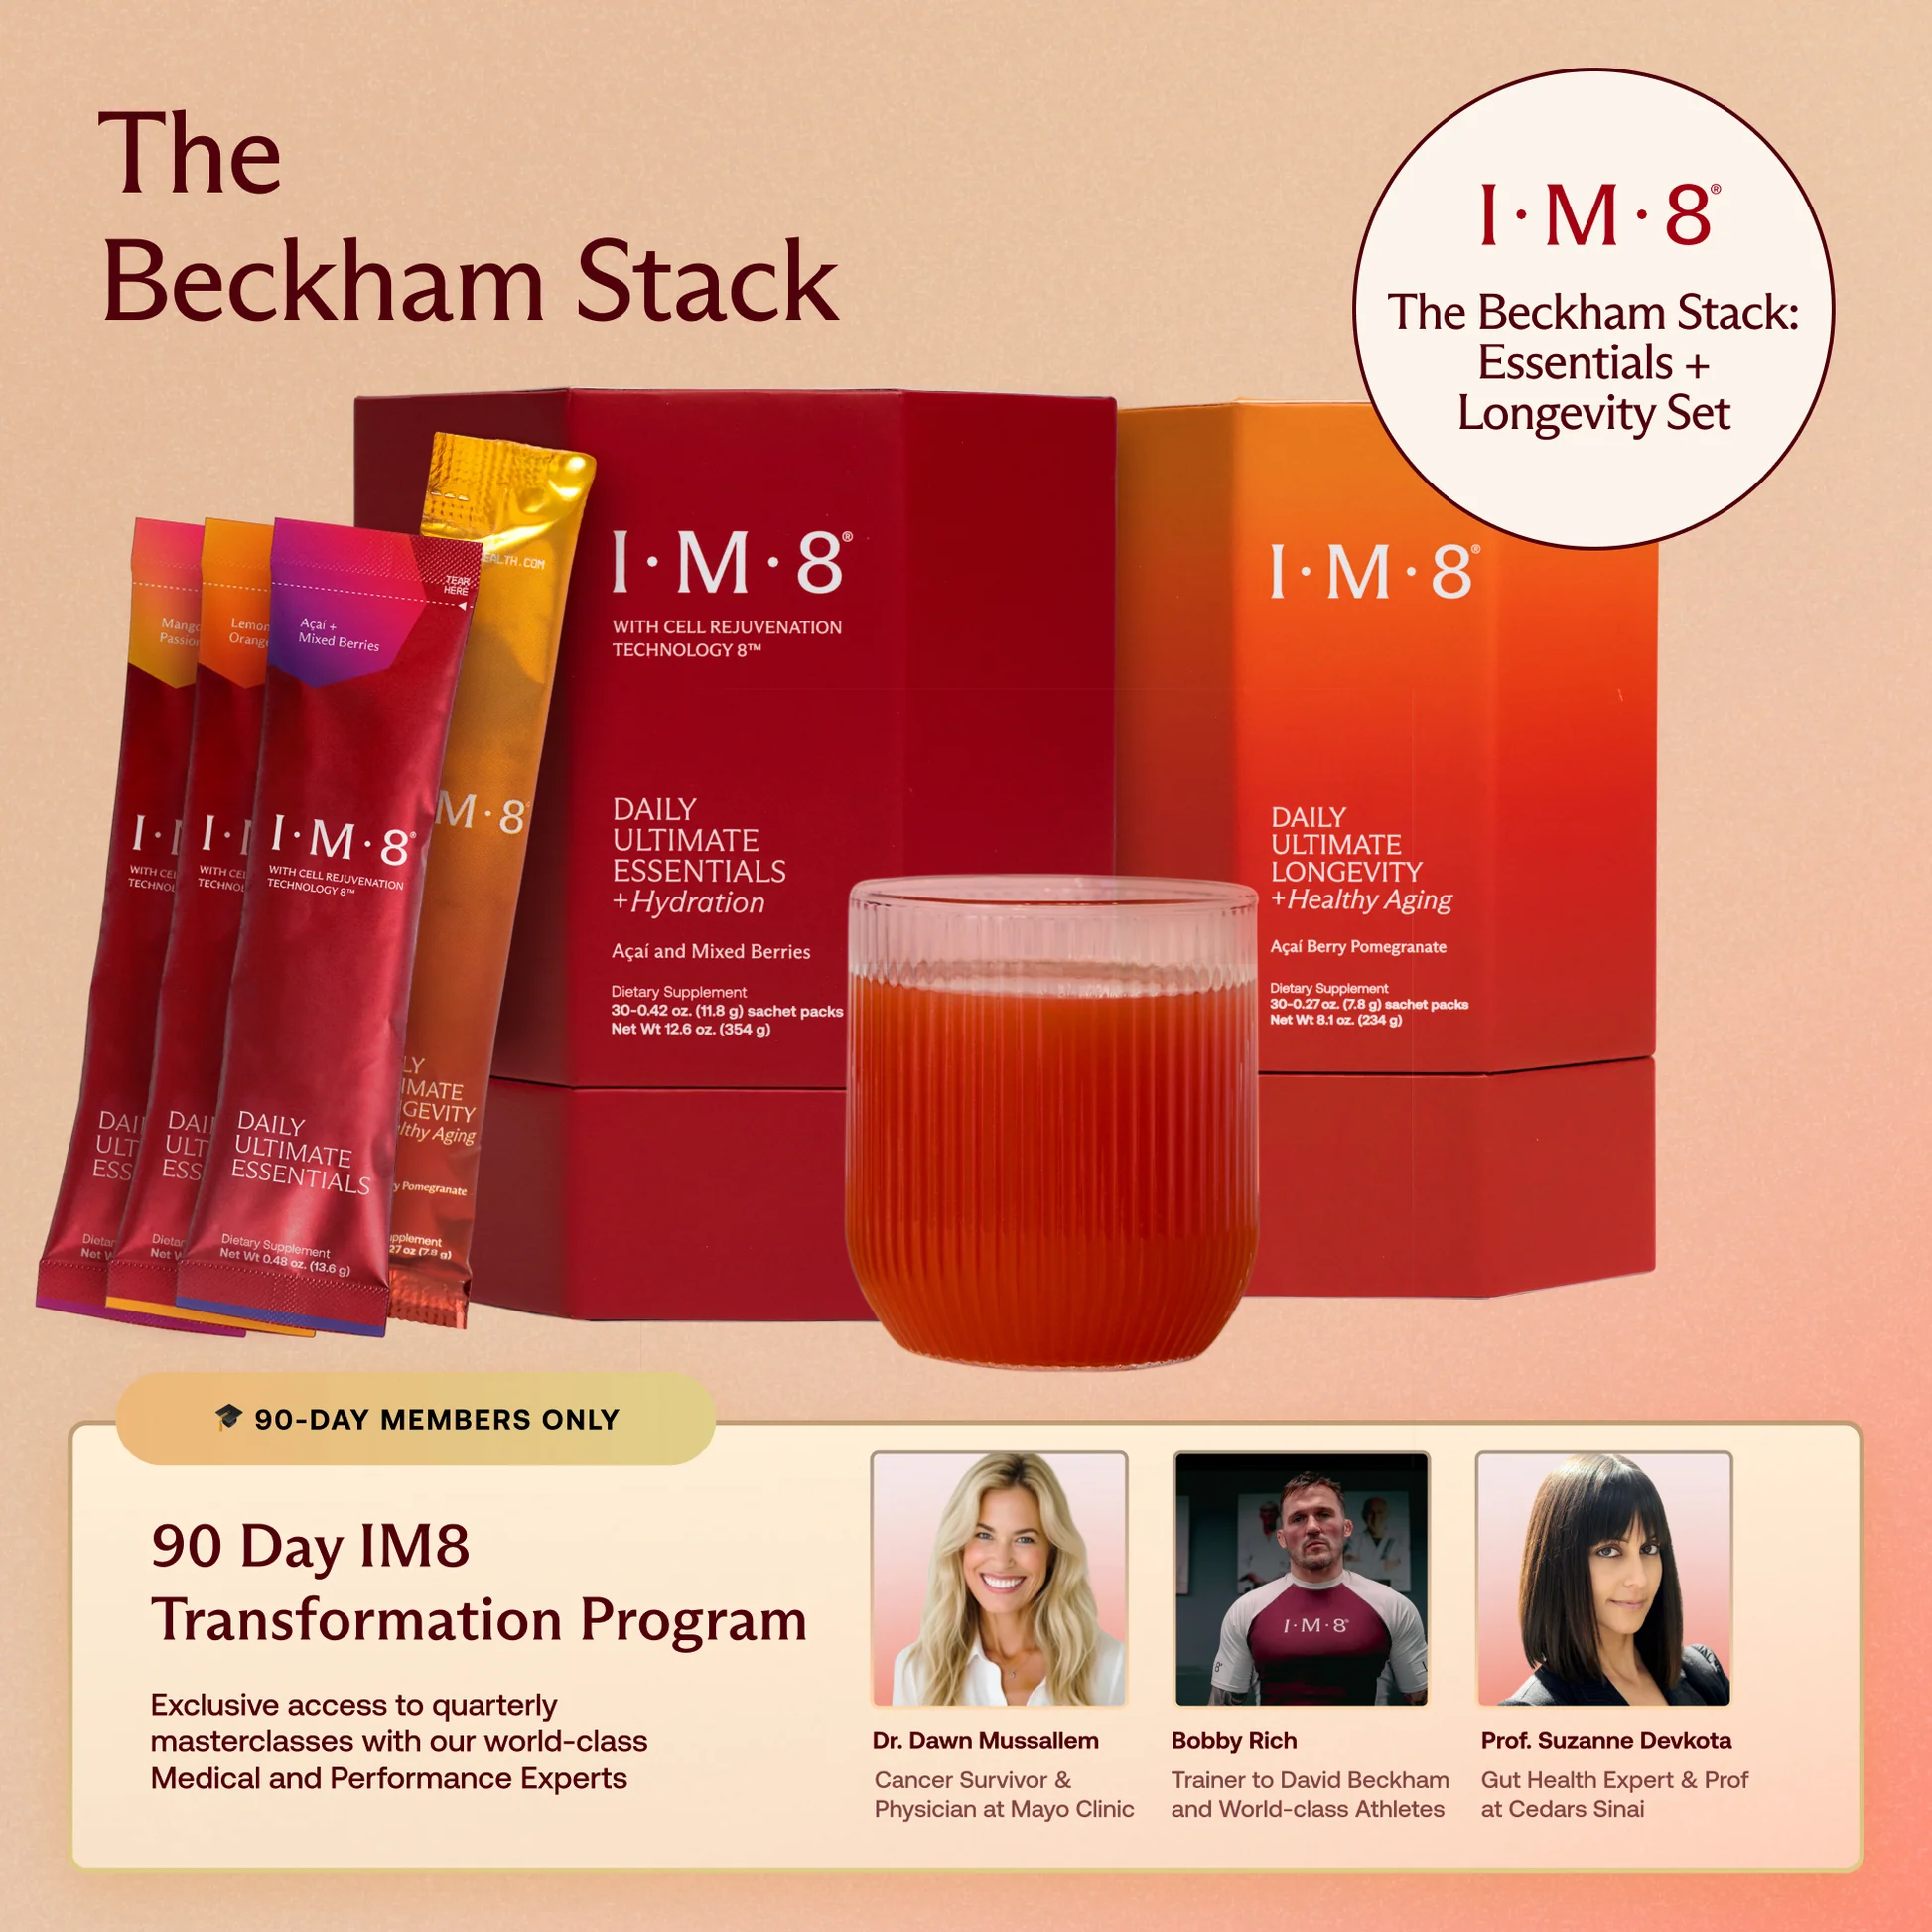
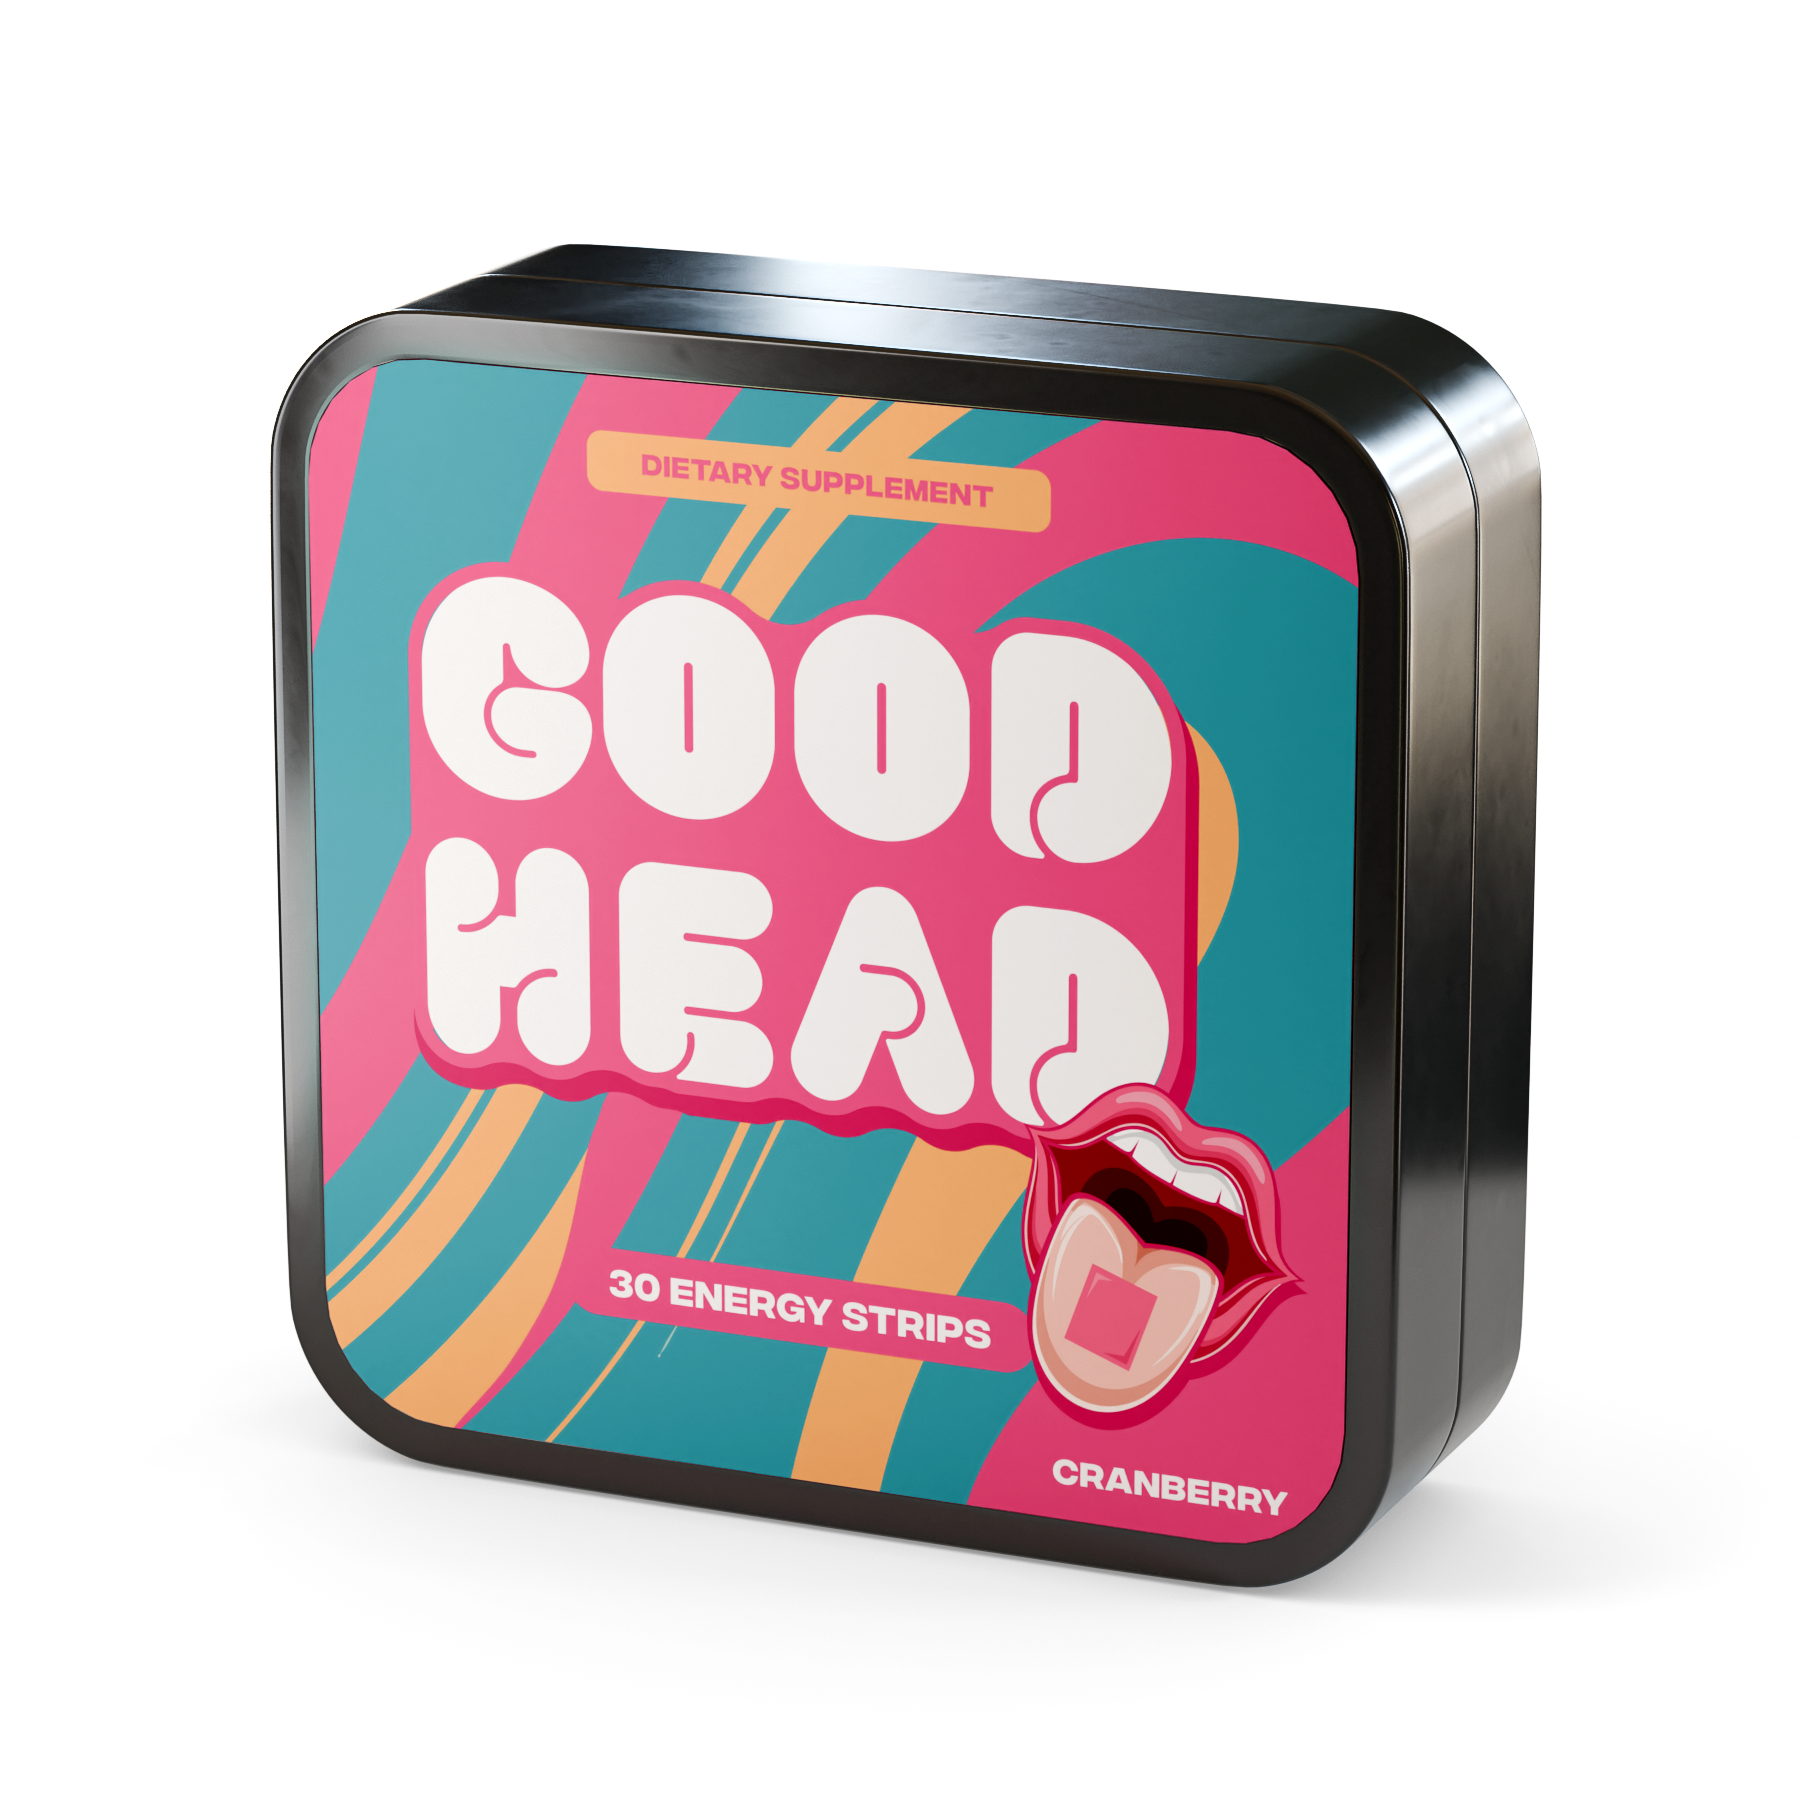
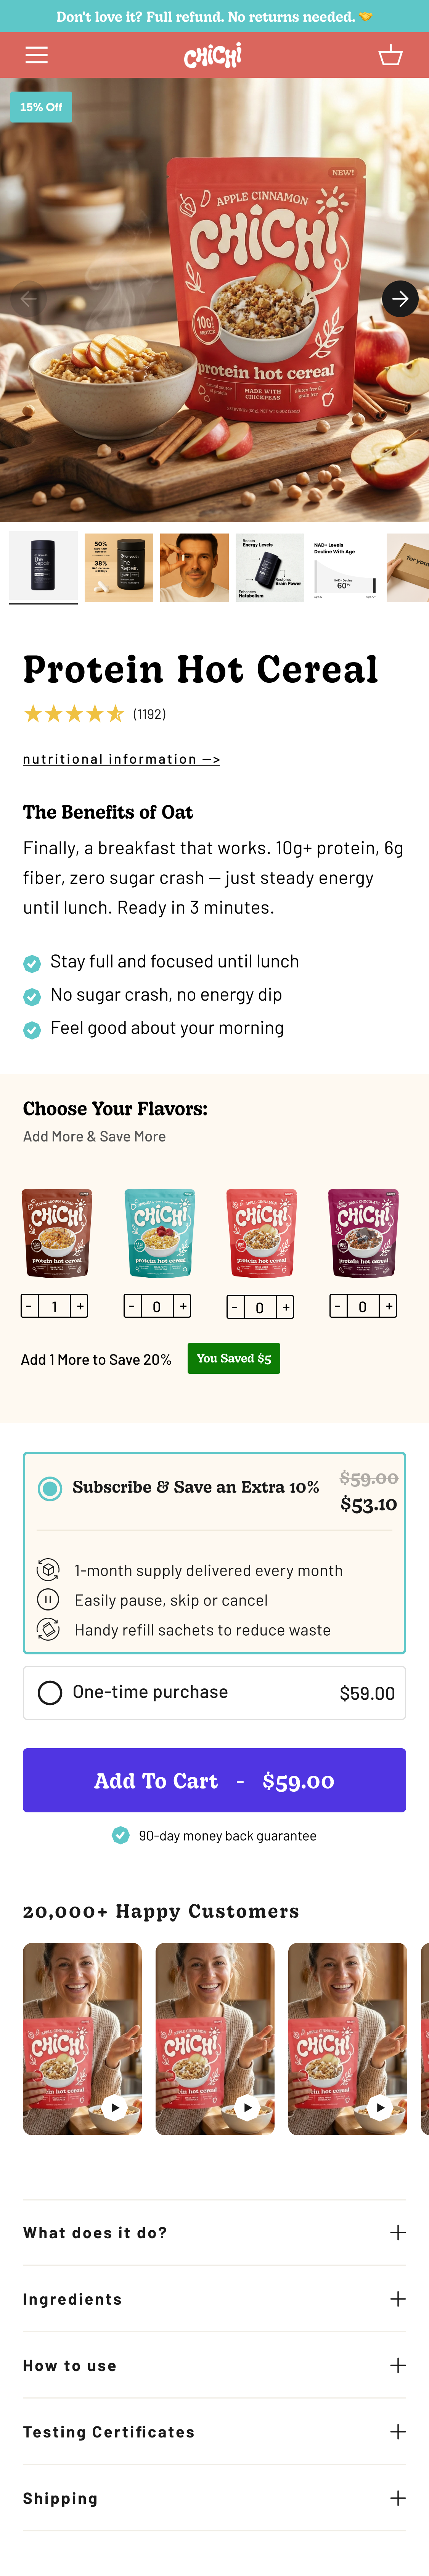
OUR INGREDIENTS.
YOUR RESULTS.
Every element engineered to outconvert — click any card to learn more
 +18% AOV on avg
WRITING
SAME TRAFFIC.
MORE MONEY.
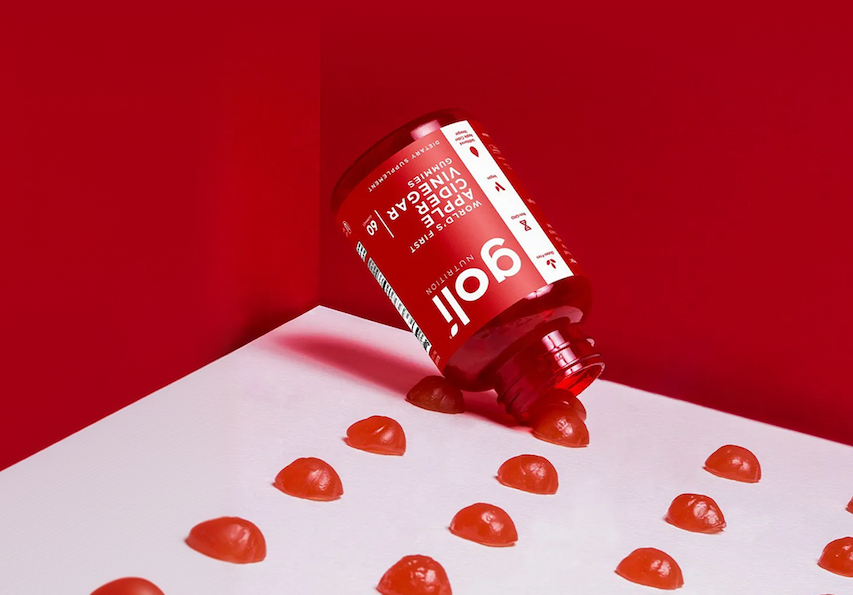
The ACV gummy that became the #2 seller on Amazon Prime Day
Goli invented the first Apple Cider Vinegar gummy and partnered with us to scale customer acquisition through affiliate partners. We recruited a diversified mix of media buyers across 12 new channels, built a content flywheel, and drove $6M+ in sales revenue.
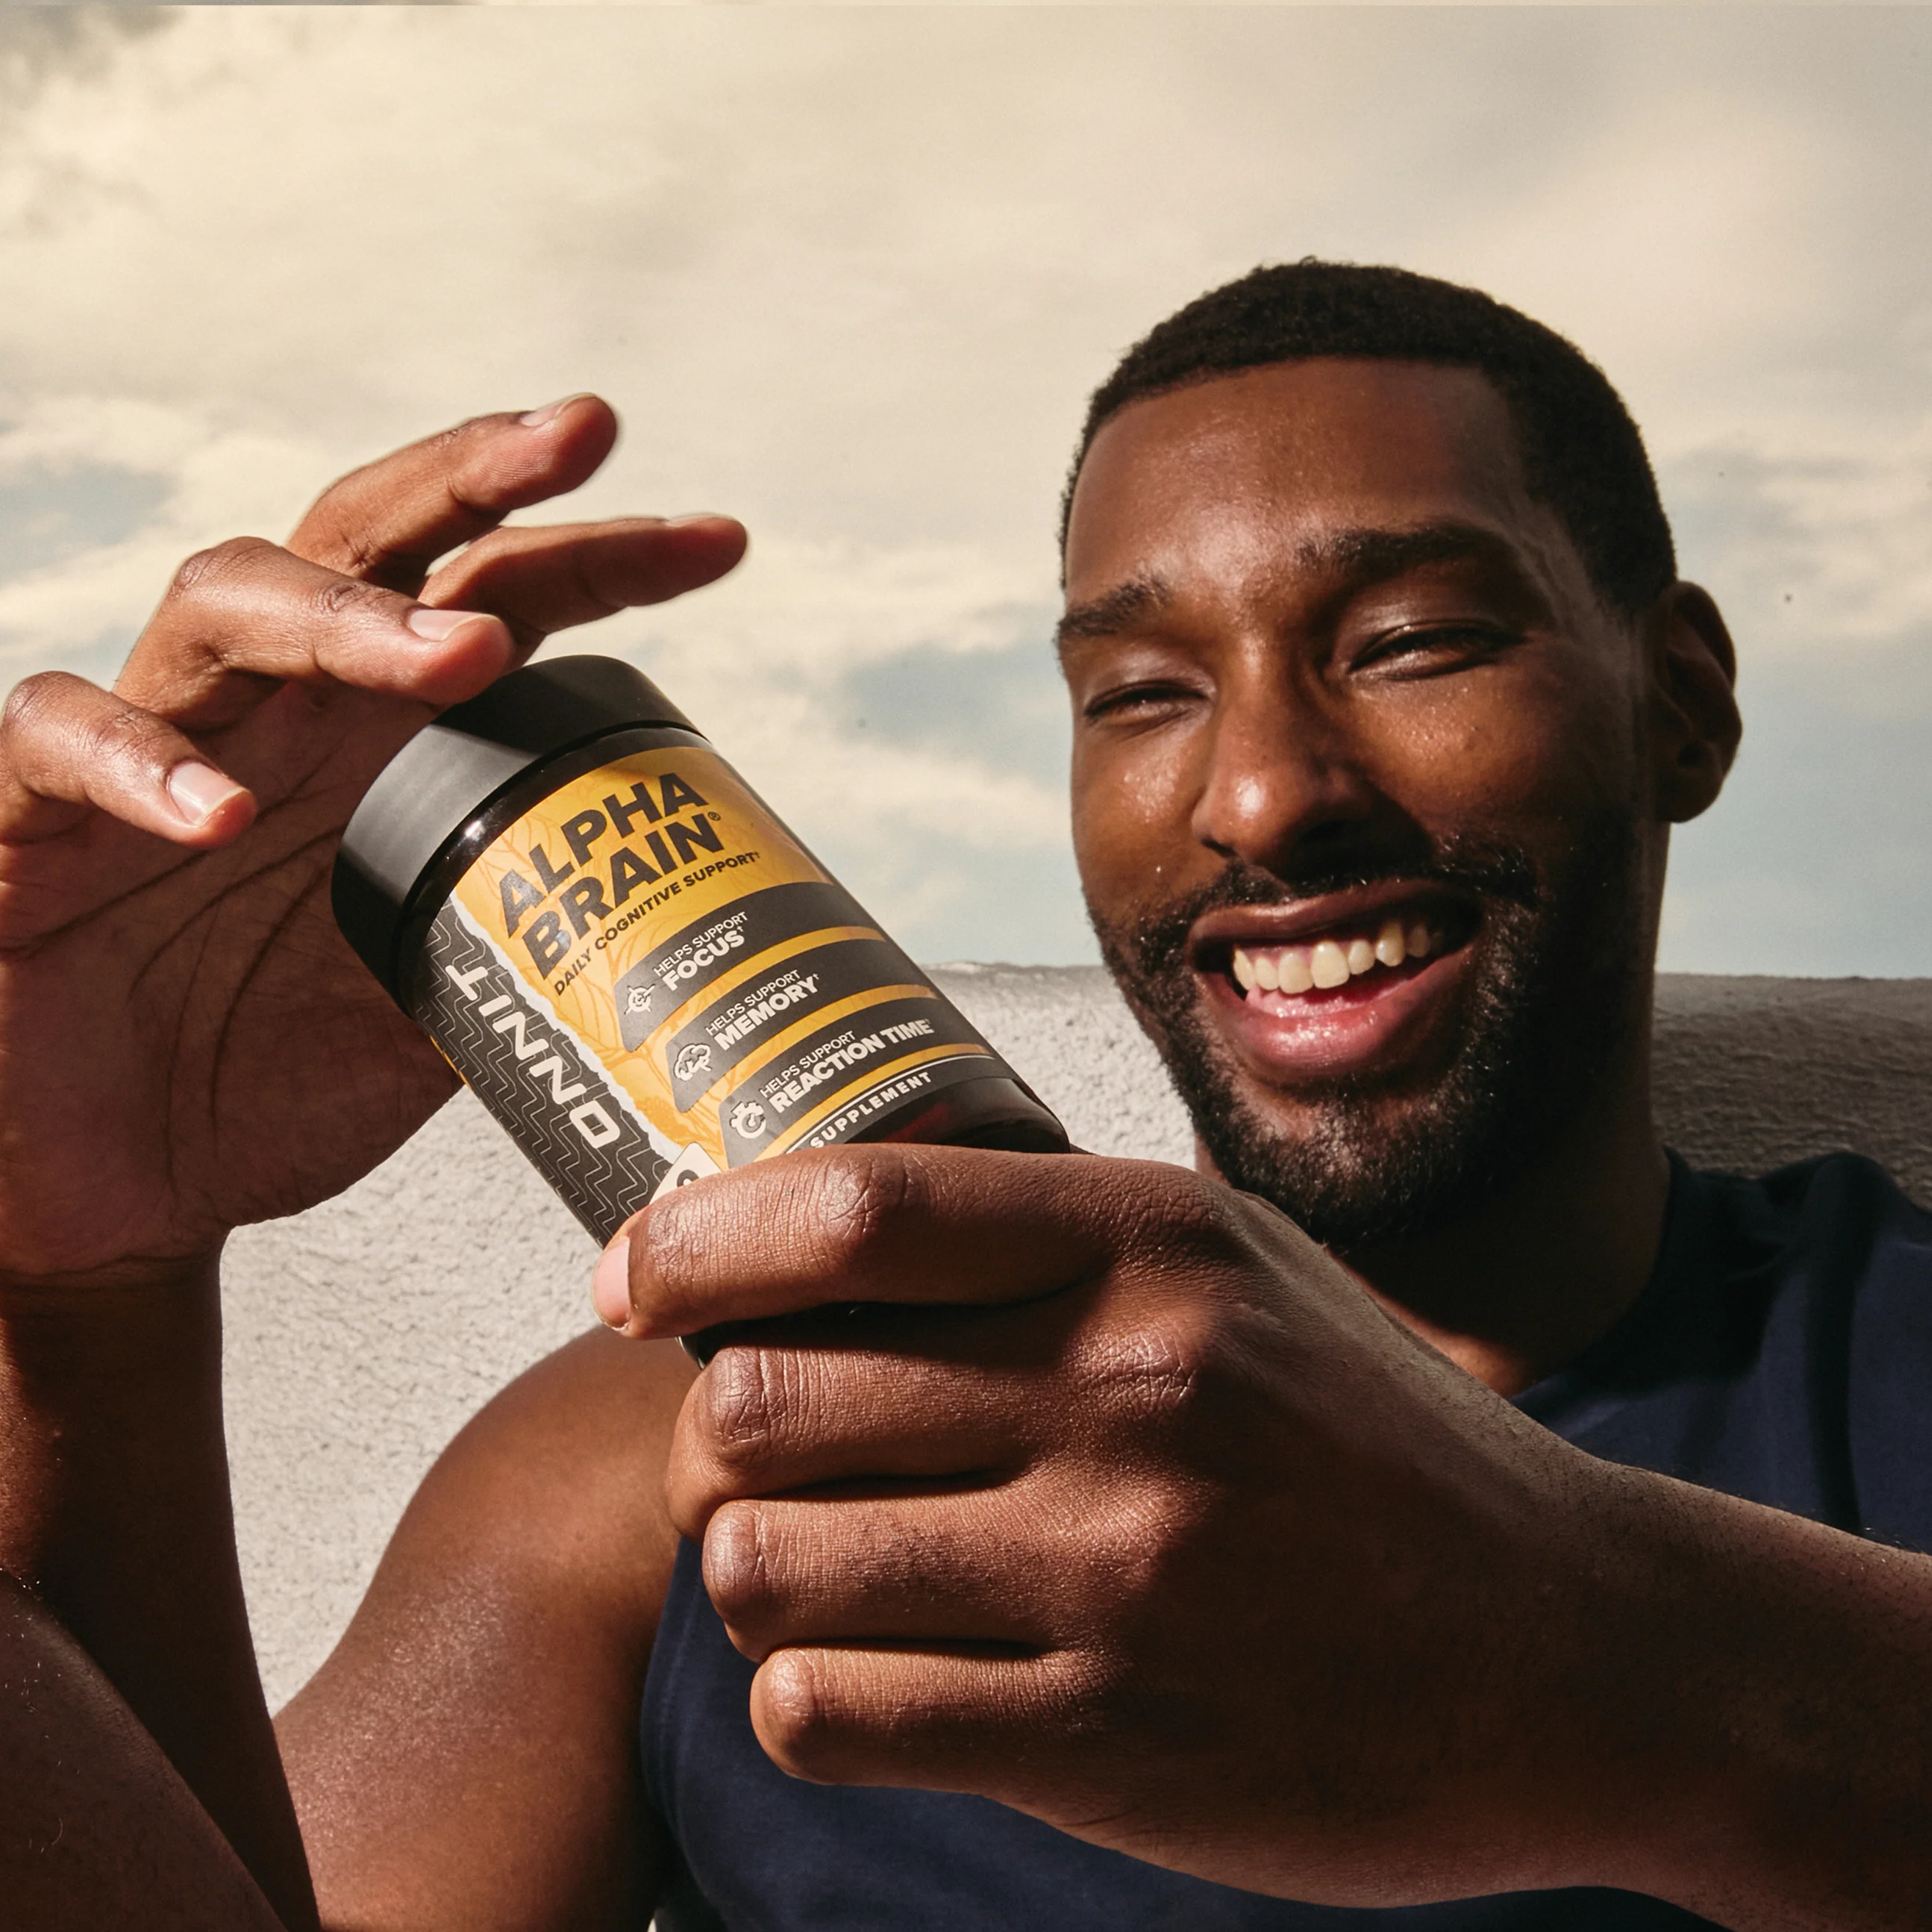
$15M+ in revenue through a partner marketing program built for scale
Onnit needed to scale Alpha Brain sales globally through a network of paid media buyers and publishers. We built high-converting landing pages, fueled a content flywheel, and expanded across 7+ traffic channels and international markets.
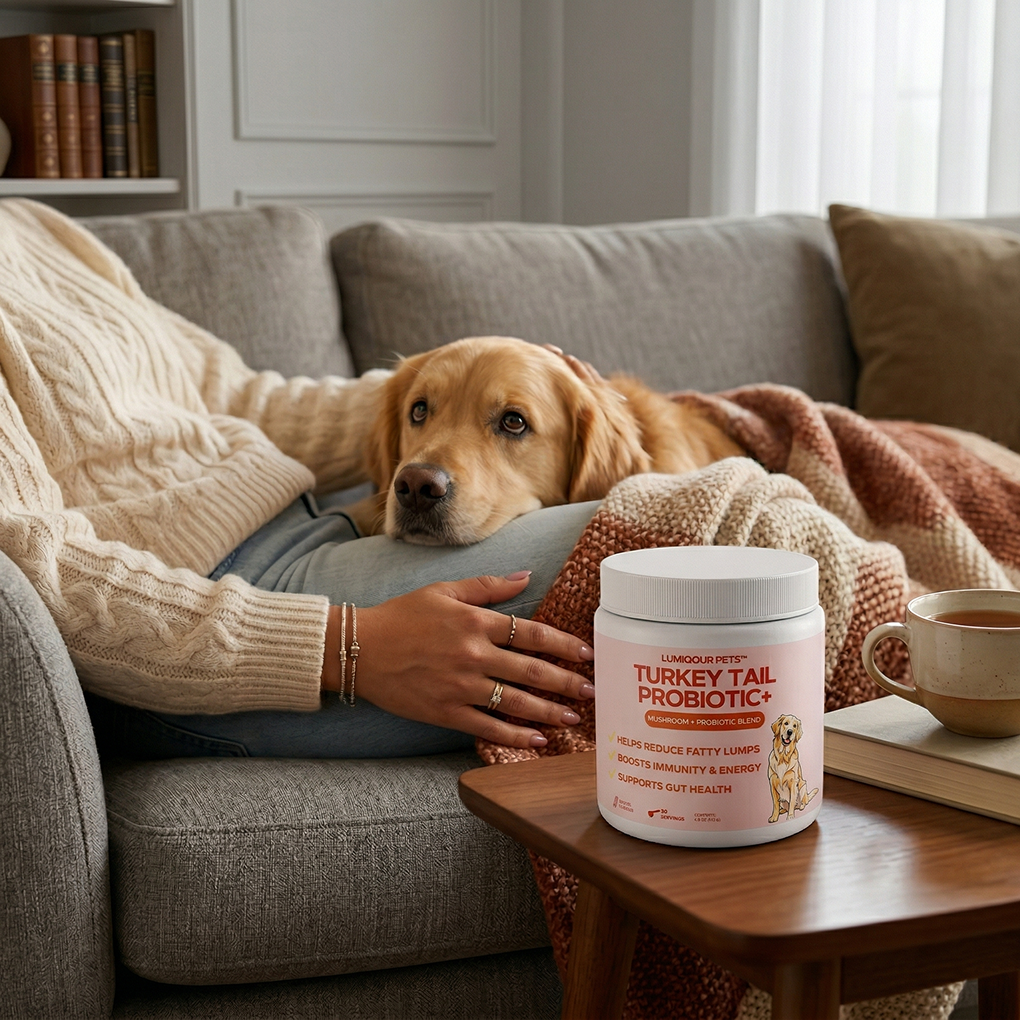
+12.7% conversion lift generating $117K+ in monthly revenue
Lumiqour Pets sells premium mushroom and probiotic supplements for dogs. We rebuilt their product page from scratch, A/B tested it across 15,851 visitors, and turned a 9.57% baseline into a confirmed winner.
3.2X ROAS with a 25% cheaper CAC
Byte is a leading at-home invisible aligner brand. We rebuilt their paid acquisition strategy, optimized creative testing, and drove profitable scale across Meta and Google.

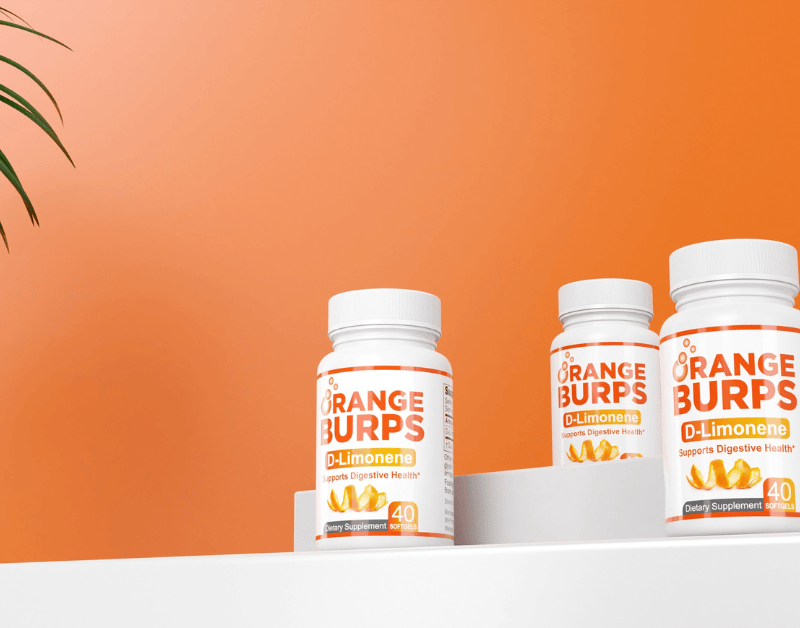
One funnel rebuild. A leaky business becomes a subscription machine.
Orange Burps had a great product and a post-click experience that was killing conversions. We redesigned the landing page, repositioned the subscription offer, and restructured the PDP to capture more value from every visit.